A list of the rural counties with the highest rates of new cases includes many with prisons and meatpacking plants. Many other counties are those with a high proportion of non-whites.
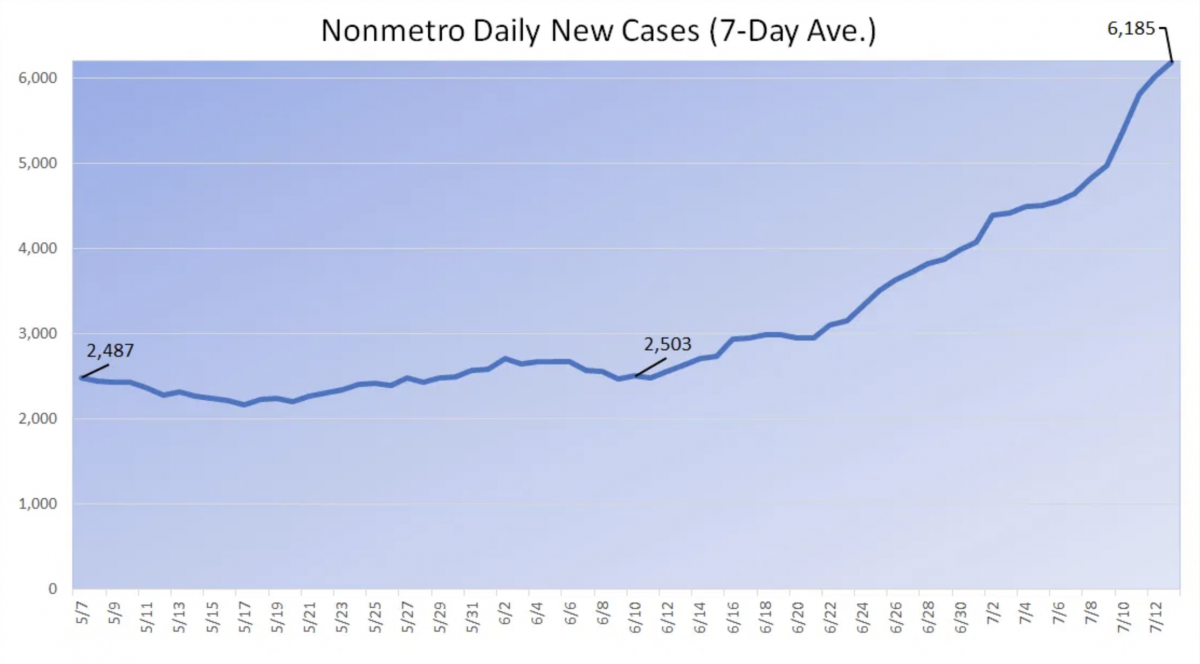
The number of new COVID-19 cases reported each day in rural counties has more than doubled in the last month, and the increase shows no signs of abating.
In the last week, nonmetropolitan counties surpassed a record-breaking 7,000 new cases on three consecutive days. The seven-day average of new cases also hit an all-time high Monday, at 6,185 per day.
The number of new cases logged each day in nonmetropolitan counties is 150 percent higher now than it was a month ago.
The Daily Yonder tracked new cases of COVID-19 in nonmetropolitan counties over the past 30 days. The counties where the equivalent of at least 1 percent of the population acquired COVID-19 from June 13 to July 12 are shown in red. Seventy-eight counties meet this criterion.

The county with the highest rate of new infections in the nation is rural Lee County, Arkansas. In the past month, the equivalent of 6 percent of the county’s population has acquired COVID-19. The outbreak is driven by infections at a state prison. The county has had 510 new cases of COVID-19 in the last month. Because the county’s population is only 8,900, the new infections translate to nearly 5,800 per 100,000 residents.
The county with the nation’s second-highest rate of new infections is also in Arkansas, according to our analysis. Like Lee County, Hot Spring County, Arkansas, has a state prison, the Ouachita River Unit. In the last 30 days, the equivalent of 3.6 percent of the county’s population of 34,000 residents has acquired COVID-19.
Rural counties with high rates of new infections tend to have state or federal prisons (including some that hold detainees for the federal Immigration and Customs Enforcement agency). Meatpacking factories are also common, as we’ve seen since the early phase of the pandemic.
The third factor is race and ethnicity. In the absence of cases from prisons and meatpacking plants, rural counties with high infection rates frequently have large proportions of residents who are African American, American Indian or Hispanic/Latino.
The county with the nation’s third-highest rate of new infections is East Carroll Parish, Louisiana. The parish’s population of about 6,900 residents is 72 percent African American.
Fifth-place Santa Cruz County, Arizona, has about 46,000 residents, 83 percent of whom are Hispanic or Latino.
And 10th place Buffalo County, South Dakota, is composed of 82 percent Native Americans. The county acquired just 47 new cases in the last month, but with a population of only 2,000, that means nearly 2.5 percent of residents contracted COVID-19 in the last 30 days.
National data show that non-whites have had higher infection rates than whites. Non-whites also have had higher rates of complications and fatalities.
The map shows the now-familiar pattern of infections across the South, concentrated in the Black Belt counties that stretch in a crescent from Virginia’s Southside to the Mississippi River. Texas is also part of the trend, with 15 rural counties on the Daily Yonder’s list of counties with the highest rates of new infections.
Indian Country has numerous hotspot counties, continuing the months-long trend of high infection rates in the New Mexico and Arizona parts of the Four Corners region.
Eastern Oregon has four counties on the rural hotspot list. And new infections in the Upper Midwest correlate with counties that had early outbreaks at meatpacking plants.
The Northeast had lower rates of new infections, as did much of the agricultural Midwest, except in counties with meatpacking plants.
The list linked here contains rural counties where the rate of new infections from June 13 to July 12 exceeded 1,000 per 100,000, or 1 percent of the population. When we have information on factors that have contributed to high infection rates, we’ve noted that. We’ve also noted counties with non-white populations that are significantly greater than national averages.
This article was originally published by the Daily Yonder. If you can shed light on what’s happening in any of these counties, drop them a note at [email protected].


