

Andy Beshear’s lead in the Kentucky gubernatorial race came largely from cities and suburbs. But a shift toward the Democratic candidate occurred across the state, compared to the 2015 governor’s election.
This time, it really was the cities and suburbs.
The television maps of Kentucky’s vote Tuesday night appeared to show that a shift in rural areas was a decisive factor in Democrat Steve Beshear’s apparent victory in the governor’s race. And there was a movement in that direction, especially in parts of Eastern Kentucky.
But the areas that gave the Democrat a lead over incumbent Governor Matt Bevin were in the state’s major cities and close-in suburbs.
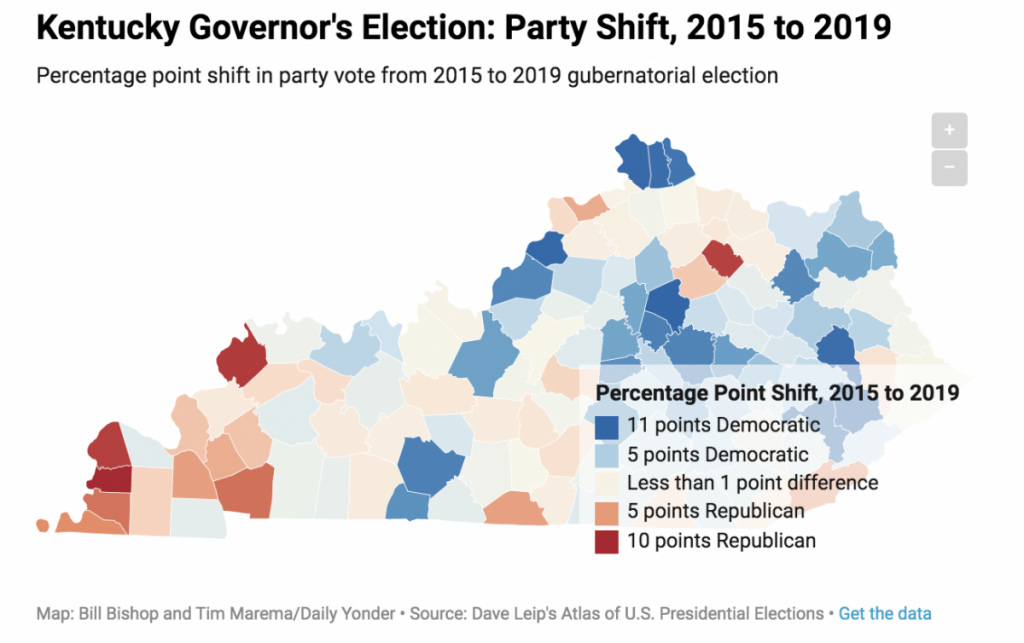
The map above shows the shift in the percent of people voting for Democrats from the 2015 governor’s race (won by Republican Bevin) to this week’s contest. Only 39 of Kentucky’s 120 counties were more Republican this week than four years earlier. Almost all counties were rural or exurban (the remotest suburbs) and they are concentrated in the western portion of the state.
The counties that moved most strongly toward the Democrats were central city counties of the major metro regions of the state and their suburbs (including those neighboring Cincinnati, Ohio). Of the seven counties where Democrats increased their share by 10 percentage points from 2015, five were attached to major metro areas.
There was a strong Democratic trend in a number of Eastern Kentucky counties. Magoffin, Knott and Perry counties (all once dependent on the coal industry) had some of the strongest Democratic shifts in the state.
But since the urban and suburban counties have much larger populations than rural counties, most of the surge in Democratic votes was tied to the cities. Democrats increased their total vote by 283,000 from 2015 to 2019. Nearly two-thirds of that increase (177,000 votes) came from the state’s major cities or suburbs.
In fact, nearly 40 percent of that increase came from just two counties, the central parts of Louisville (Jefferson County) and Lexington (Fayette County).
Explore an interactive map of Kentucky’s election results here.
The increase in voter turnout was massive in Kentucky, compared to 2015. The Democratic vote increased by 66 percent from 2015 to 2019. The Republican turnout increased by 37.7 percent – a huge gain but not enough to offset the Democratic surge.
The Democratic vote in downtown Lexington nearly doubled.
The Washington Post has a sophisticated analysis of the urban, suburban and rural shifts in Kentucky’s elections. It finds that the split between central cities and counties farther from city centers has widened since 2015.
The Yonder finds the same widening gap. For example, there was a 22.5 percentage point difference in the Democratic vote between Louisville (Jefferson County) and the state’s most rural counties in 2015. This week, the gap was 29.6 points.
Bill Bishop is a contributing editor and co-founder of the Daily Yonder.
This article was originally published by the Daily Yonder.