

As the politicians frequently point out, the rural population has a greater percentage of veterans than the urban population does. But that’s not true for younger veterans
It’s not news that rural America accounts for a disproportionately high percentage of U.S. veterans. But for younger veterans, the trend has reversed. Veterans of the First and Second Gulf Wars are slightly more likely to live in cities than in rural areas, based on the relative population of urban counties.
Nationally, about 8.0% of the U.S. population 18 and older are veterans, using American Community Survey data from 2012-2016. In rural areas, veterans make up 9.6% of that population, while in metropolitan areas, they make up 7.7%. That’s makes the rural service rate about 20 percent higher than the urban one.
But rural America’s disproportionate share of veterans comes from older military personnel – those who served during the Vietnam and Korean eras. About half of all rural veterans served during those wars, while only about 45% of urban veterans served then. The declining number of World War II-era veterans account for just under 6% of the population in both rural and urban counties.
For the two Gulf Wars, which began in 1990 and 2003, respectively, the urban and rural proportions are reversed. More than a third of urban veterans served during the Gulf Wars, while only about a quarter of rural veterans served during those periods.
The trend is not surprising when you consider that the average age is higher in rural areas. If veterans follow the same age trends as the rest of rural America, they are more likely to have served during older eras.
As we’ve observed with other data like voting, the patterns established in rural communities don’t stop abruptly as counties become metropolitan. There’s quite a bit of variation depending on the size of the metropolitan area and whether a county is in the city core or the suburbs.
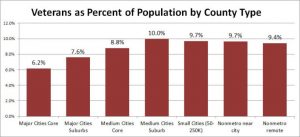
The graph below shows the percentage of the 18 and older population that are veterans. The percent of veterans climbs steadily from the core counties of the nation’s largest metro areas and peaks in the suburban counties of medium-sized metro. That rate holds relatively steady for small metro counties and nonmetropolitan counties.
We used ACS 2012-2016 data compiled in the Atlas of Rural and Small-Town America, the excellent reference tool produced by the Economic Research Service of the Department of Agriculture. The ACS compiles data from five separate years to create a larger sample size, but the estimates have a margin of error.
This article was originally published by Daily Yonder.