A massive new study shows which districts are having a bigger impact on student performance. The results might surprise you.
A new study that examines educational progress of millions of U.S. pupils over a five-year span finds that there are few patterns for predicting how geography or socio-economic status affect student improvement.
Rural school districts don’t seem to do much better or worse than urban districts in raising student test scores over time. And both poor districts and rich districts have good and bad results. (The only exception is the generally good results in Tennessee.)
The massive study by Stanford University professor Sean Reardon looks at standardized test scores of students in the third grade and again, five years later, when that same year of students reaches the eighth grade. The difference in test scores from third to eighth grade shows how much the student performance in U.S. school districts improved over the five-year period.
The map above shows the results. Red counties are rural where students gained less than five grade levels; green counties are rural where students gained five or more years between third and eighth grades.
Orange counties are metro areas with gains under five years; blue are metro counties with gains of five years or more.
Gray counties have school districts too small to achieve meaningful results.
Children who spend five years in school ought to advance five grade levels on standardized tests. But that doesn’t always happen, Reardon found. Children in some school districts fall behind; others gain more than five grade levels.
On the interactive map you can see the results for your home county. Reardon reports test scores for children in third grade, again in eighth grade and then the change in those five years. His study considers only math and reading scores and covers the 2008-9 to 2014-15 school years.
(See a full explanation of the study on the Stanford website. And the New York Times has an easy way to find information on specific school districts by district name.)
Reardon conducted his study in an attempt to find a way to judge school quality based on something other than static, end-of-the-year test scores. After all, children come to school with different abilities. Some districts are filled with students who enter school already testing well below grade level. Districts with many poor students have children coming into third grade a year and a half behind. Tests that just measure year-end results don’t reflect these differences. They also don’t show the growth of children over time — they don’t measure what impact the schools are having.
End of school tests only give a snapshot of a class. They don’t measure whether children are improving. And they don’t give any hint about school quality.
Reardon wanted to measure student growth over time. So he first determined the grade level of children in third grade. His theory was that “third grade average test scores can be thought of as measures of the average extent of educational opportunities available to students in a community prior to age 9.” He then gathered the same information five years later as students left eighth grade. The difference in the standardized tests score is a measurement of the change in student performance over the period.
Reardon collected some 300 million standardized reading and math test scores from 45 million students in over 11,000 school districts spanning the school years 2008-09 to 2014-15. Reardon was able to devise a national standard by comparing state test scores to the National Assessment of Educational Progress, a long-running test of students across the United States.
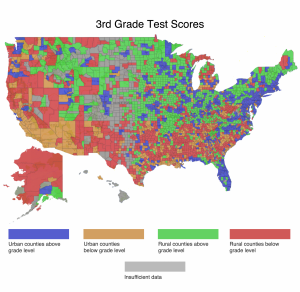
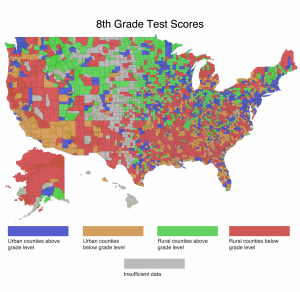
The map at the top of the page shows the change in test results. The two maps below show, first, the average grade level of students in the third grade. The next map shows the average grade level of student five years later in the eighth grade.


(In both maps, red counties are rural and below grade level; green are rural and above grade level. Orange counties are urban and below grade level and blue are counties with the average student testing above grade level. Again, gray counties are too small to have meaningful results. County grade level information is included in the interactive map asbove.
There is little correlation between the average scores in third grade and the growth rate of those students over the next five years. Reardon writes that “knowing a district’s average third grade scores tells us almost nothing about the rate at which average scores change from third to eighth grade. Or, put in terms of opportunity, the communities where children experience high opportunities to learn in early childhood and early elementary school are not necessarily those where opportunities to learn are high in the elementary and middle school years, and vice versa.”
Yes, districts with poorer students have lower test scores for third grade students. But that doesn’t seem to affect growth rates. Districts with poor students can show high growth rates while some districts with rich students report low growth rates.
Reardon is hesitant to give all the credit (or blame) for growth rates to schools. Educational achievement can be affected by neighborhood conditions, after school programs or resources available to families.
Reardon’s point is that any state system that rewards or sanctions schools based only on the results of one year’s test is missing the boat. Focus instead on the change.
And Reardon contends his study shows that schools and communities can provide students, especially students from poor families, with opportunities to learn. To find those places that are succeeding, this study suggests we look to the green and blue counties on the map.
This article was originally published on The Daily Yonder.


